


.png)


I watched in horror as my trading account bled red. The stock I was convinced would keep climbing had suddenly reversed, plummeting 15% in two days. Another painful lesson in the school of hard knocks.

What if you could see these reversals coming before they happen? What if instead of being the trader caught on the wrong side, you could be the one calmly taking profits while others panic?
This isn’t fantasy. The most successful traders have mastered this skill — identifying market turning points with surprising accuracy. Today, I’m pulling back the curtain on their methods.
Why Most Traders Get Caught in Reversals
Let’s face facts: buying bottoms and selling tops is the holy grail of trading. Yet 90% of traders consistently do the opposite — buying near market tops and selling near market bottoms.
The psychology is simple:
- At market tops, everything looks rosy — positive news, upward momentum, and everyone around you making money
- At market bottoms, doom prevails — negative headlines, downward pressure, and widespread fear
Traditional indicators offer little help because they’re lagging — they tell you what’s already happened, not what’s about to happen.

What you need is a leading edge — something that spots the internal weakness or strength before price confirms it.
The Secret Weapon: Price & Momentum Reversal Indicator
After years of frustration with standard technical tools, we developed the Price & Momentum Reversal Indicator to solve exactly this problem.

Unlike conventional indicators, it doesn’t just measure price; it tracks the relationship between price and underlying momentum, identifying when they fall out of sync.
Here’s why this matters:
Before every significant price reversal, momentum starts shifting first. It’s like a car slowing down before making a U-turn — it must decelerate before changing direction.
The indicator captures this deceleration phase through a proprietary algorithm that measures:
- Momentum extremes using a modified Chande Momentum Oscillator
- Momentum divergence from price action
- Historical patterns that precede reversals
- Multi-timeframe confirmation for enhanced accuracy
Real-World Example: Catching Apple’s 25% Rally
In June 2022, Apple (AAPL) was getting crushed along with other tech stocks. The stock had fallen from $180 to $130, with analysts predicting further drops.
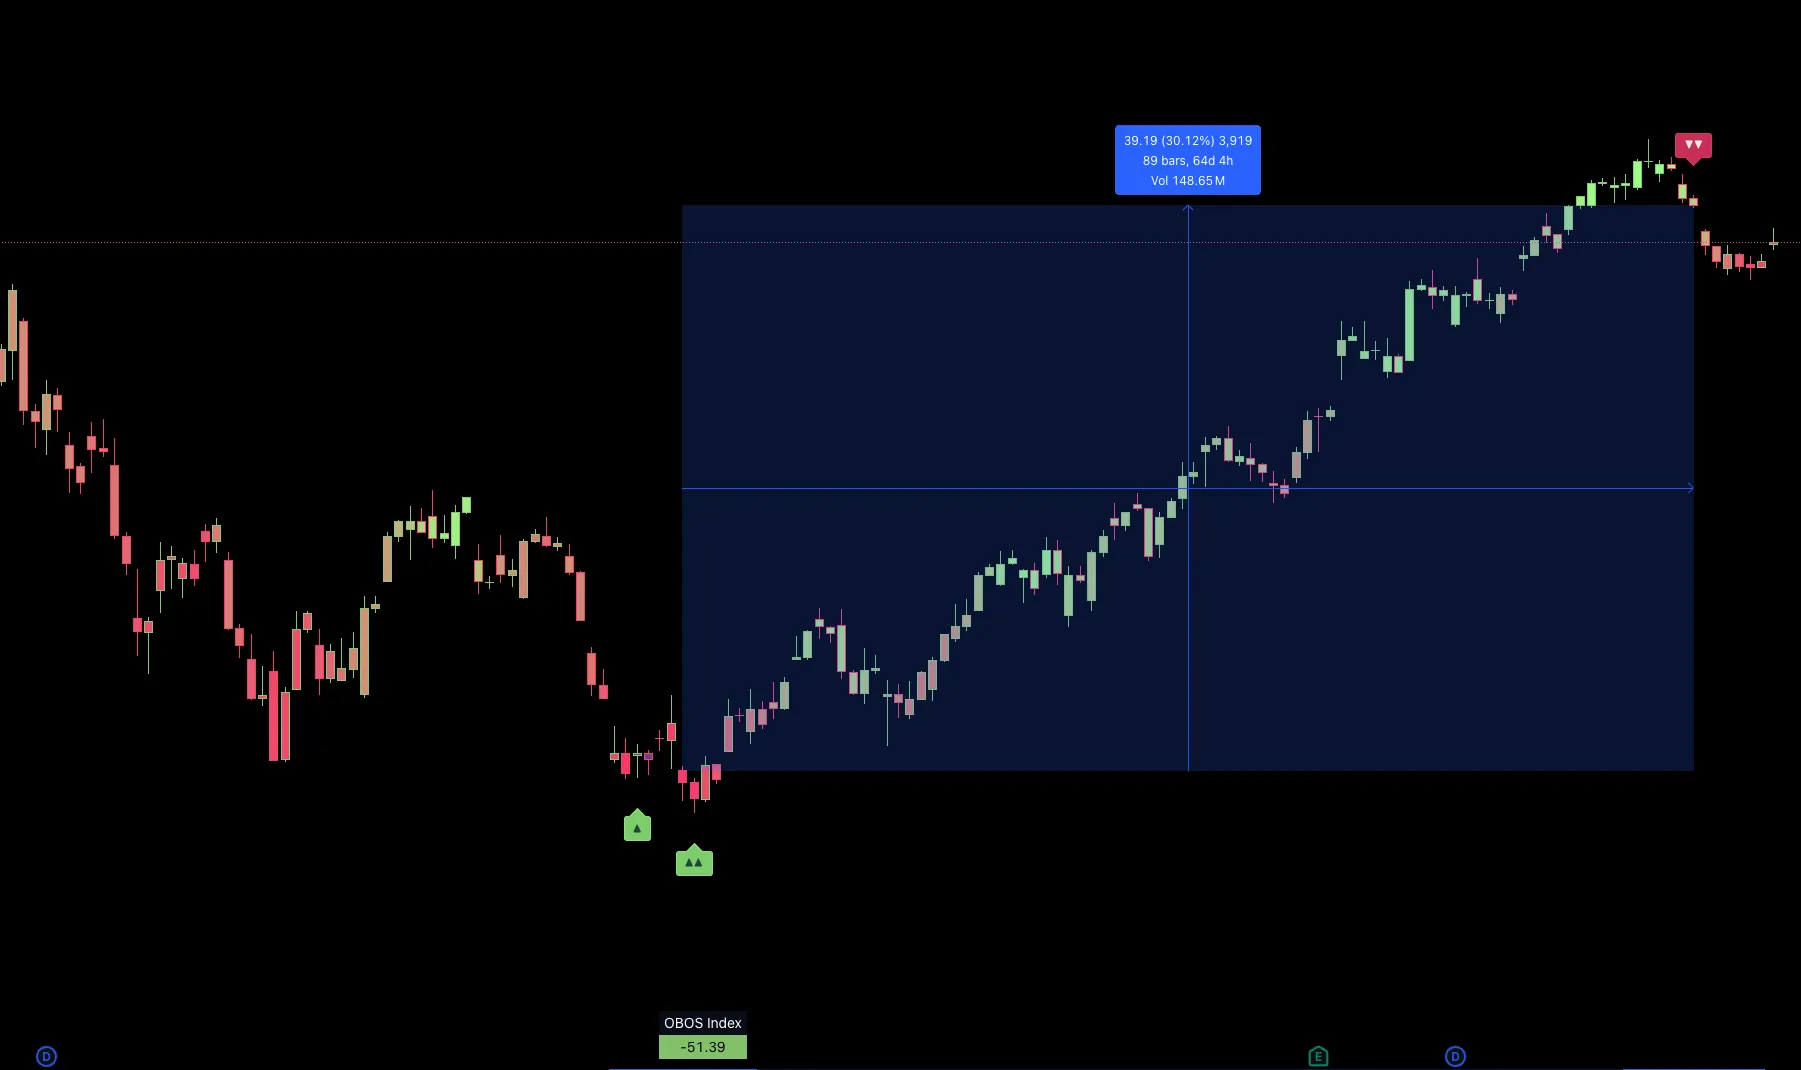
While most traders remained bearish, our Price & Momentum Reversal Indicator flashed a powerful bullish signal on June 14:
- The OBOS (Overbought/Oversold) Index hit an extreme -63.5 reading (deeply oversold)
- A bullish reversal triangle (▲) appeared on the chart
- Momentum began turning upward despite price still making lower lows
- The Higher Timeframe (HTF) analysis confirmed with a bullish signal


A trader entering at this signal around $130 would have captured almost the exact bottom. By August, Apple had climbed to $176 — a 33% gain in just seven weeks.

What’s remarkable isn’t just the profit potential, but the precision. The indicator identified the reversal within days of the actual bottom, giving traders ample opportunity to position themselves.
Bitcoin’s 2022 Collapse: Selling Near the Top
The indicator is equally powerful for identifying potential tops.
In November 2021, as Bitcoin approached $69,000 and crypto euphoria was at its peak, our indicator was flashing warning signs:
- The OBOS Index reached an extreme reading above +66 (heavily overbought)
- A bearish reversal triangle (▼) appeared right before the all-time high
- Momentum began declining while price was still making higher highs

Traders who recognized these signals could have protected profits or established short positions. Within six months, Bitcoin had collapsed to $20,000 — a 70% drop.

How Beginners Can Start Catching Reversals Today
Here’s your step-by-step blueprint:
Step 1: Set Up Your Reversal Detection System
With the Price & Momentum Reversal Indicator, use these beginner-friendly settings:-
- Sensitivity (Length): 7 (default)
- Overbought threshold: +40
- Oversold threshold: -40
- Visual settings: Enable “Show Labels” and “Full” candlestick coloring
- Higher Timeframe Analysis: Enabled
Step 2: Follow the Reversal Hunting Process
For potential buying opportunities:
- Identify oversold conditions — Look for the OBOS Index below -40
- Wait for momentum shift — The OBOS line should start turning upward
- Confirm with signal — Look for a bullish triangle (▲) on your chart
- Check higher timeframe — For stronger signals, look for HTF confirmation (▲▲)
- Verify price action — Wait for a candle close above the signal candle
For potential selling opportunities, reverse the process:
- Identify overbought conditions — Look for the OBOS Index above +40
- Wait for momentum shift — The OBOS line should start turning downward
- Confirm with signal — Look for a bearish triangle (▼) on your chart
- Check higher timeframe — For stronger signals, look for HTF confirmation (▼▼)
- Verify price action — Wait for a candle close below the signal candle
Step 3: Implement Smart Risk Management
Even the best reversal signals aren’t 100% accurate. Protect yourself with these guidelines:
- Position sizing: Risk no more than 1% of your capital per trade
- Stop placement: Set stops beyond the recent swing low (for buys) or high (for sells)
- Profit targets: Take partial profits at 1:1 risk/reward, let remainder run with trailing stop
- Expectation management: Aim for 60–65% win rate with proper risk management
Advanced Reversal Trading Techniques
Once you’ve mastered the basics, try these advanced approaches:
Technique 1: Divergence Confirmation
The most powerful reversal signals often come with divergence — when price makes a new extreme but momentum doesn’t confirm it.
Look for these high-probability setups:
- Price makes a lower low, but the OBOS Index makes a higher low (bullish)
- Price makes a higher high, but the OBOS Index makes a lower high (bearish)
Technique 2: Volume Confirmation
Volume provides valuable confirmation for reversal signals:
- At potential bottoms: Look for increasing volume as price reverses upward
- At potential tops: Look for climactic volume followed by price rejection
Technique 3: Market-Specific Optimization
Different markets have different volatility characteristics. Optimize your settings:
- Stocks: Standard settings work well (±40 thresholds)
- Crypto: Consider wider thresholds (±50) due to higher volatility
- Forex: Consider tighter thresholds (±30) for major pairs
- Commodities: Adjust sensitivity to 9–11 for smoother signals
Common Mistakes in Reversal Trading (And How to Avoid Them)
I’ve trained hundreds of traders in reversal techniques. Here are the most common pitfalls:
- Trying to catch every signal — Solution: Focus on A+ setups with multiple confirmations
- Fighting strong trends — Solution: Give more weight to reversal signals in the direction of the larger trend
- Placing stops too tight — Solution: Set stops based on market structure, not arbitrary distances
- Ignoring timeframe context — Solution: Ensure your trading timeframe aligns with your goals (day trading vs. swing trading)
- Overtrading — Solution: Quality over quantity — wait for high-conviction setups
The Psychological Advantage of Reversal Trading
Beyond technical benefits, reversal trading gives you a profound psychological edge. When you buy near bottoms and sell near tops, you’re:
- Trading against the crowd, not with it
- Buying when assets are undervalued, not overvalued
- Selling when euphoria peaks, not when fear dominates
- Positioning yourself ahead of institutional money flows
This contrarian approach is mentally challenging but financially rewarding. The Price & Momentum Reversal Indicator helps remove emotion from the equation by providing objective signals.
Transform Your Trading With Reversal Detection
Imagine opening your charts and having clear, objective signals showing potential market turning points. No more guesswork. No more hoping. Just data-driven decisions about where markets might reverse.
That’s the power of mastering reversal detection — turning market uncertainty into probability-based opportunities.
Whether you’re a day trader looking for intraday reversals or a swing trader targeting major market turns, the ability to identify potential reversals before they happen can transform your trading results.
The Price & Momentum Reversal Indicator doesn’t just show you when markets might turn — it gives you the confidence to act when others are frozen by fear or blinded by greed.
Ready to Start Hunting Reversals?
The market’s next major turning point is coming. The question is: will you spot it before everyone else?
With the right tools and approach, you can position yourself to buy when others are panicking and sell when others are chasing — the essence of profitable trading.
Want to see the Price & Momentum Reversal Indicator in action on your favorite markets? Start your free 7-day trial today. Spot potential market turning points before they happen and transform your trading results.
Additional Resources
Stay connected for more insightful blogs and updates, and join our telegram community for free trading ideas and stock watch alerts.
Twitter: https://twitter.com/tradedots
YouTube: https://youtube.com/@tradedots/
Telegram: https://t.me/tradedots_official
About TradeDots
TradeDots is a revolutionary AI-powered quantitative trading firm built by traders, for traders. We transform complex institutional-grade analysis into intuitive, powerful tools that everyday traders can actually use.
Our team of professional traders and AI specialists has developed a suite of smart indicators that identify high-probability trading opportunities across any market: stocks, crypto, forex, futures, or commodities.
Experience the TradeDots advantage with our 7-day FREE Trial. No complicated setup. Just powerful trading insights that can transform your results from day one.
Disclaimer: This article is for informational purposes only and does not constitute financial advice. Investing involves risks, and it’s important to conduct your own research or consult with a financial professional before making investment decisions.

